
|
advertisement |
|
|
|
tell a friend!
software reviews bestseller list price survey what's new product support search educational tools ask a scientist math worksheets vocabulary builders hangman iPhone/iPad apps logic games brain food educational insights feature articles marketplace iPhone/iPad apps reading corner movie corner SuperKids home about SuperKids advertise! humor links help * * * Promotions * * * |
home > >
features
Does class size matter?
|
|
Why are we doing so poorly?
One reason commonly heard, is that classes are too large. Teachers don't have the time to provide individualized attention when they've got kids stacked up to the rafters in their classrooms.
But does class size really matter? SuperKids looked at this question 10 years ago, and the answer then was "yes". Using data from a standard 4th grade reading test given in all 50 states, we looked to see if there was a correlation between test scores and class size. Our analysis then showed that states with more small classes generally had higher scores than states with fewer small classes. Smaller classes presumably allowed teachers to provide more attention to their student's individual needs, resulting in more learning, and better performance on the tests.
Ten years later, we wondered if the relationship still held true, and if it extended to other subjects, like math and science?
|
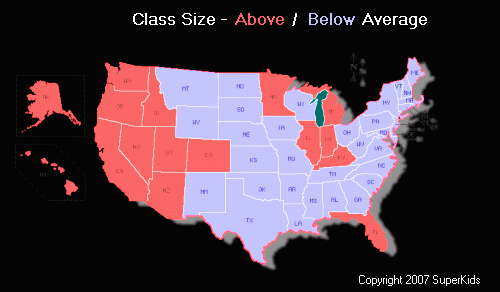
There are large differences in student/teacher ratios among the states. In 2004, public school student/teacher ratios varied by a factor of two, or 100%, from a low of 11.3 in Vermont, to a high of 22.6 in Utah. That sounded like a big difference to us, until we looked at the difference in test score performance among the states.
Using the percent of test-takers that scored 'proficient' or higher for their grade level on their tests, we discovered a vast gulf between the high and low-scoring states.
Bottom-line: we're not sure if we're more disturbed by the three-fold difference in proficiency between some states on these tests, or the fact that less than half of the students on any test, in any state, received scores of proficient or better.
Methodology
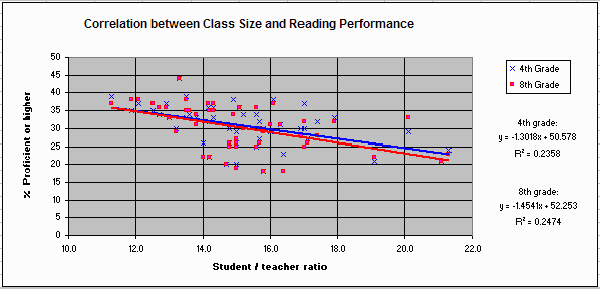
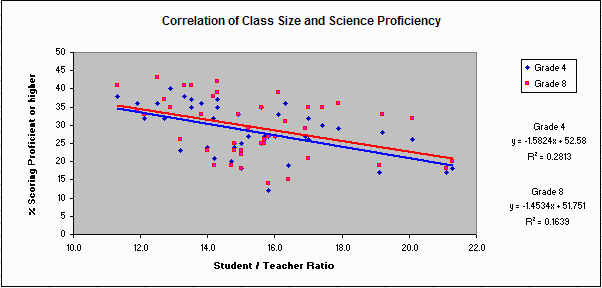
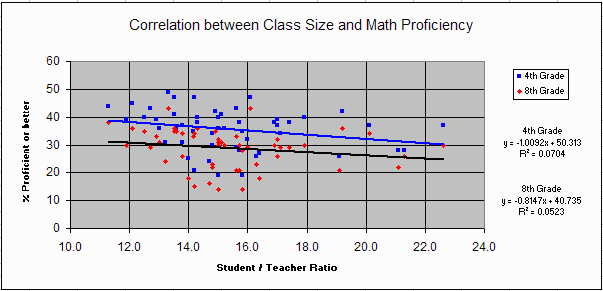
Using the same methodology used in our previous study - a standard linear regression model - SuperKids analyzed the relationship between student/teacher ratios and scores on NAEP tests given in 2005 to 4th and 8th graders in Reading, Math, and Science.
Findings
Although we found once again that there was a general correlation between class size and test scores - with smaller classes producing better results - this time we discovered that the influence of class size was stronger in some subjects than in others:
|
|
|
Want to see more information on how your state compares? Check out the 2005 NAEP test results.
The Data
For our performance data we elected to continue using scores from the National Assessment of Educational Progress (NAEP) tests, a congressionally mandated survey that has been administered by the National Center for Education Statistics (NCES) in the U.S. Department of Education since 1969. Unlike many other tests now given as part of the No Child Left Behind Program, these tests are uniform across the country, do not have entire curriculums built around their questions, and don't drive teacher, school and district performance evaluations. They are a relatively pure assessment test designed to evaluate the quality of our education system, and the results are submited to Congress as part of "The Nation's Report Card."
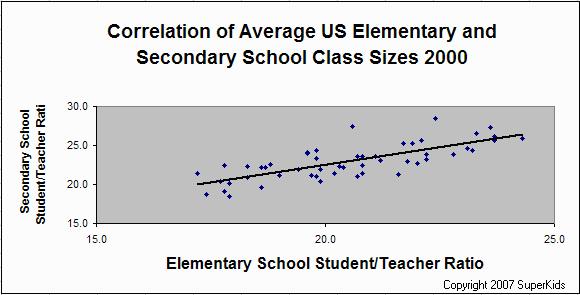
For class size data, we turned to data for public elementary and secondary schools from the NCES for the same time period. (Note: In an ideal analysis, we would have matched class size data for specific grades with their test scores. Lacking that specific data, we used average student/teacher ratios for all grades after determining that there was a strong correlation between elementary and secondary school class sizes within each state.)